引入所需要的库
import os
import torch
import torch.nn as nn
import torch.nn.functional as F
from collections import OrderedDict
一个简单的函数
z = 3 y 2 = 3 ( x + 2 ) 2 z = 3y^2 = 3(x+2)^2z=3y
2
=3(x+2)
2
out = mean ( z ) \text{out} = \text{mean}(z)out=mean(z)
∂ z ∂ x = 6 ( x + 2 ) 2 \frac{\partial z}{\partial x} = \frac{6(x+2)}{2}
∂x
∂z
=
2
6(x+2)
大家想想,这里的公式为什么要除2?
代码如下:
x = torch.tensor([[1., 2.]], requires_grad=True)
y = x + 2
z = 3 * y.pow(2)
out = z.mean() # you can try sum() to see what is the result.
out.backward()
print(f"x: {x}")
print(f"y->x: {y}")
print(f"z->y->x: {z}")
print(f"out: {out}")
print(f"out->z->y->x: {x.grad}")
输出如下
x: tensor([[1., 2.]], requires_grad=True)
y->x: tensor([[3., 4.]], grad_fn=<AddBackward0>)
z->y->x: tensor([[27., 48.]], grad_fn=<MulBackward0>)
out: 37.5
out->z->y->x: tensor([[ 9., 12.]])
这里解释一下,x 是定义一个tensor,并设置requires_grad=True,这个意思就是x需要计算梯度。其它的注释已经标注挺清楚的了
class ToyModel(nn.Module):
def __init__(self, in_channels, out_channels, num_classes=2):
super().__init__()
# tmp only for testing, not valid
self.tmp = nn.Conv2d(in_channels, in_channels * 2, (3, 3))
self.dim = out_channels
self.conv1 = nn.Conv2d(in_channels=in_channels,
out_channels=in_channels * 2,
kernel_size=(3, 3),
stride=(1, 1),
padding=0)
self.conv2 = nn.Conv2d(in_channels=in_channels * 2,
out_channels=out_channels,
kernel_size=(3, 3),
stride=(1, 1),
padding=0)
self.pool = nn.AdaptiveAvgPool2d(output_size=(1))
self.fc = nn.Linear(out_channels, num_classes, bias=False)
def forward(self, x):
x = F.relu(self.conv1(x))
x = F.relu(self.conv2(x))
x = self.pool(x)
x = self.fc(x.view(-1, self.dim))
return x
def get_model_histogram(model):
"""
Description:
- get norm gradients from model, and store in a OrderDict
Args:
- model: (torch.nn.Module), torch model
Returns:
- grads in OrderDict
"""
grads = OrderedDict()
for name, params in model.named_parameters():
grad = params.grad
if grad is not None:
tmp = {}
params_np = grad.numpy()
histogram, bins = np.histogram(params_np.flatten())
tmp['histogram'] = list(histogram)
tmp['bins'] = list(bins)
grads[name] = tmp
return grads
def get_model_norm_gradient(model):
"""
Description:
- get norm gradients from model, and store in a OrderDict
Args:
- model: (torch.nn.Module), torch model
Returns:
- grads in OrderDict
"""
grads = OrderedDict()
for name, params in model.named_parameters():
grad = params.grad
if grad is not None:
grads[name] = grad.norm().item()
return grads
get model norm gradient的输出如下
================================================================================
OrderedDict([('conv1.weight', 0.1473149210214615), ('conv1.bias', 0.16713829338550568), ('conv2.weight', 0.9203198552131653), ('conv2.bias', 0.5442095994949341), ('fc.weight', 1.7258217334747314)])
================================================================================
OrderedDict([('conv1.weight', 0.0349930003285408), ('conv1.bias', 0.03801438584923744), ('conv2.weight', 0.20729205012321472), ('conv2.bias', 0.12616902589797974), ('fc.weight', 0.39913201332092285)])
================================================================================
OrderedDict([('conv1.weight', 0.07812522351741791), ('conv1.bias', 0.08833323419094086), ('conv2.weight', 0.49012720584869385), ('conv2.bias', 0.2875416576862335), ('fc.weight', 0.9168939590454102)])
================================================================================
OrderedDict([('conv1.weight', 0.14530049264431), ('conv1.bias', 0.16511967778205872), ('conv2.weight', 0.9190732836723328), ('conv2.bias', 0.5398930907249451), ('fc.weight', 1.7265493869781494)])
torch.manual_seed(0)
num_data = 40
toy_model = ToyModel(3, 64, 2)
data = torch.randn(num_data, 3, 224, 224)
label = torch.randint(0, 2, (num_data,))
criterion = nn.CrossEntropyLoss()
optimizer = torch.optim.SGD(toy_model.parameters(), lr=1e-3)
toy_model.train()
for i, data in enumerate(data):
data = data.unsqueeze(0)
out = toy_model(data)
target = label[i].unsqueeze(0)
loss = criterion(out, target)
loss.backward()
if (i + 1) % 10 == 0:
print('=' * 80)
# fix 2022-04-27 histo not defined
# print(str(get_model_histogram(toy_model)))
histo = (get_model_histogram(toy_model))
print(histo)
optimizer.step()
optimizer.zero_grad()
get model histogram 输出如下,输出太多,只显示最后一条输入了
================================================================================
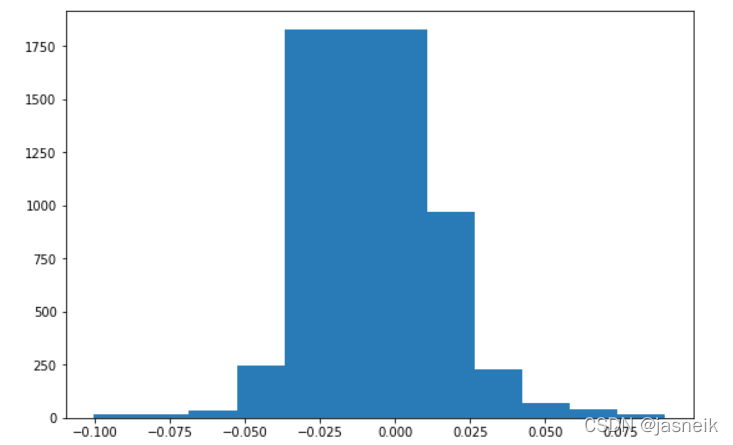
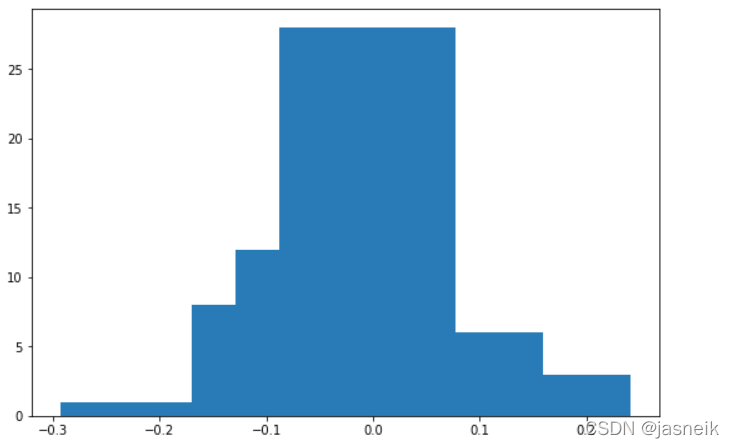
OrderedDict([('conv1.weight', {'histogram': [4, 2, 13, 27, 76, 22, 11, 5, 1, 1], 'bins': [-0.036256444, -0.028072663, -0.019888882, -0.0117051015, -0.0035213209, 0.0046624597, 0.012846241, 0.021030022, 0.029213801, 0.037397582, 0.045581363]}), ('conv1.bias', {'histogram': [1, 2, 0, 0, 1, 0, 1, 0, 0, 1], 'bins': [-0.028756114, -0.012518765, 0.0037185834, 0.019955931, 0.03619328, 0.05243063, 0.06866798, 0.08490533, 0.101142675, 0.11738002, 0.13361737]}), ('conv2.weight', {'histogram': [15, 10, 35, 245, 1828, 970, 230, 68, 40, 15], 'bins': [-0.07653718, -0.060686104, -0.044835035, -0.028983962, -0.013132891, 0.0027181804, 0.018569252, 0.034420323, 0.050271396, 0.066122465, 0.08197354]}), ('conv2.bias', {'histogram': [1, 0, 1, 8, 12, 28, 5, 6, 0, 3], 'bins': [-0.21087514, -0.16971013, -0.1285451, -0.0873801, -0.04621508, -0.005050063, 0.036114953, 0.07727997, 0.11844498, 0.15961, 0.20077501]}), ('fc.weight', {'histogram': [1, 7, 11, 12, 33, 33, 12, 11, 7, 1], 'bins': [-0.41966814, -0.33573452, -0.2518009, -0.16786726, -0.08393363, 0.0, 0.08393363, 0.16786726, 0.2518009, 0.33573452, 0.41966814]})])
可视化一下梯度的histogram
import matplotlib.pyplot as plt
import matplotlib
%matplotlib inline
data = histo['conv2.weight']
bins = data['bins']
histogram = data['histogram']
max_idx = np.argmax(histogram)
min_idx = np.argmin(histogram)
width = abs(bins[max_idx] - bins[min_idx])
plt.figure(figsize=(9, 6))
plt.bar(bins[:-1], histogram, width=width)
plt.show()
data = histo['conv2.bias']
bins = data['bins']
histogram = data['histogram']
max_idx = np.argmax(histogram)
min_idx = np.argmin(histogram)
width = abs(bins[max_idx] - bins[min_idx])
plt.figure(figsize=(9, 6))
plt.bar(bins[:-1], histogram, width=width)
plt.show()
文章
10.51W+人气
19粉丝
1关注
更多数字孪生可视化干货内容


 扫一扫关注公众号
 扫一扫联系客服
©Copyrights 2016-2022 杭州易知微科技有限公司 浙ICP备2021017017号-3  浙公网安备33011002011932号
互联网信息服务业务 合字B2-20220090