如上图所示,我们用canvas绘制了一条灰色的路径,并在路径上绘制了一条流动的线条,线条在运动过程中。始终保持渐变色,这种沿路径渐变的效果是一般的渐变(线性渐变、径向渐变)无法做到的,要实现这个效果,我们需要将流光切割成多段直线,每段直线都用不同的渐变色绘制,最终使其整体保持同一个渐变色。
1.首先我们需要准备以下几个“必须品”:
a.路径的点位数据,这里只考虑直线路径,如果夹杂了曲线的话就不好计算了。
let pathData = [
    [100,100],
    [200,100],
    [250,150],
    [250,200],
    [230,250],
    [170,170],
    [140,230],
    [100,230]
];
b.流光头部颜色和尾部颜色,这里为了简化计算,只考虑了两种颜色的渐变。
const headColor = {r:255,g:255,b:0,a:1}, tailColor={r:255,g:0,b:0,a:0.2};c.流光的长度和流光的偏移值offset,offset决定了在每一帧绘制时,流光所处的位置。
const lightLen = 100;
let offset = 0;
d.最后就是你的html页面里必须有一个canvas元素,然后获取它的2d上下文对象即可
const canvas = document.getElementById("canvas");
const ctx = canvas.getContext("2d");
2.初始化轨迹对象,由于底下的灰色轨迹在每一帧的绘制中都是不变的,所以我们可以先用一个Path2D对象将其存储起来。
const track = initPathObj();
function initPathObj(){
let path = new Path2D();
path.moveTo(pathData[0][0],pathData[0][1]);
pathData.slice(1).forEach(d=>{
path.lineTo(d[0],d[1]);
});
return path;
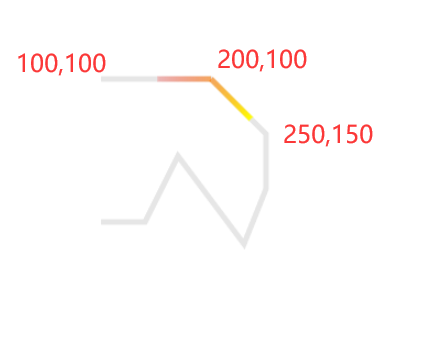
}3.在开启帧动画之前,先根据路径数据(pathData)将整条路径切割成多条线段,计算出每段线的 offset 范围,线性函数,起点和终点坐标,与x轴的夹角。为什么要计算这些东西呢?首先我们要明白,决定流光的绘制位置时,是只有一个变量offset的,在不同的 offset 下,流光将被转折点切割成n段直线,那么我们要怎么计算出这n段直线的路径数据呢?以下图为例,流光所在的路径包含了三个转折点,它们的坐标分别为(100,100),(200,100),(250,150),假设此时的offset=150,我们要怎么得到流光的起点、转折点和终点的坐标呢?
首先我们可以根据坐标值,计算出两段路径的线性函数分别为:y=100,y=x-100,它们对应的偏移值区间分别为[0,100],[100,100+50*根号2], 然后根据流光长度(lightLen),偏移值(offset),我们能得知整个流光的区间在 [50,150],很显然,终点位于区间[0,100]之间,而起点位于区间[100,100+50根号2]之间,根据点位所属的区间,我们可以轻易找到每个点所在线段的线性函数,然后根据偏移值计算出点位的 x,y 坐标......好吧,仅根据线性函数是无法得到 x,y 坐标的,因为我们的 offset 表示的是线段长度,想要将线段长度转换成 x,y 坐标,我们还需要借助于三角函数 sin 和 cos,线性函数提供给我们有用的信息就是它的 k 值,根据 atan 函数,我们可以将斜率转换成线段与x轴的弧度值 rad ,拿到 rad 后,根据 x = offset*Math.cos(rad) 和 y = offset*Math.sin(rad) 我们才能得到 x,y 坐标。不过这里需要注意的是,atan函数拿到的弧度值在 -π/2 和 π/2之间(对应的是第四象限和第一象限),并不是360度的,所以我们还需要根据 x 的向量(终点x坐标-起点x坐标=dx)来决定 rad是否需要增加 π。dx<0时 rad+π。
生成路径每条线段信息的函数如下所示,该函数同时获取了整条路径的总长度(sum),便于后面的计算:
const { paths, sum } = formatPath(pathData);
function formatPath(data){
    let sum = 0;
    let res = [];
    data.slice(1).forEach((d, i)=>{
        const [x1, y1] = data[i], [x2, y2] = d;
        const dx = x2-x1, dy = y2-y1;
        const dis = Math.sqrt(dx**2+dy**2);     //两点之间的距离
        const range = [sum, sum+dis];
        const rad = dx==0?(dy>0?1:-1)*Math.PI/2:Math.atan(dy/dx)+(dx<0?Math.PI:0);
        res.push({
            dis,
            pos:[[x1,y1], [x2,y2]],      //线段的起始点坐标
            range,        //线段所含区间
            rad,  //线段与x轴的夹角
            linearFn:(offset)=>[x1 + (offset-range[0]) * Math.cos(rad), y1 + (offset-range[0]) * Math.sin(rad)]
        });
        sum+=dis;
    });
    return {paths:res,sum};
}
4.接下来开启帧动画,在每一帧中,我们需要根据 offset 的值来计算流光的各个点坐标以及渐变色。计算流光点坐标的方法其实在第三步中已经有所提及,下面我们来实现代码:
const lines = calcPoints(paths, [offset-lightLen, offset]);
function calcPoints(paths, steps){
    const [step1, step2] = steps;
    return paths.flatMap(d=>{
        const [small, large]=d.range;
        if(small>=step1 && large<=step2){     // __|__|__
            return [d.pos];
        }else if(small<=step1 && large>=step2){       // | ___ |
            return [[d.linearFn(step1),d.linearFn(step2)]];
        }else if(small<=step1&& large>=step1){       // | __|__
            return [[d.linearFn(step1),d.pos[1]]];
        }else if(small<=step2 && large>=step2){       // __|__ |
            return [[d.pos[0],d.linearFn(step2)]];
        }
        return [];
    });
}
计算流光点坐标的函数有两个参数,第一个是整条路径的线段数据,第二个参数是个数组,需要传入的是流光的 offset 区间,函数实现其实很简单,我们遍历每条线段,根据线段区间和流光区间的相对关系,计算出每段流光在每段线段中的点坐标。(代码注释里的竖线表示线段区间,下划线表示流光)
完成这一步,其实我们已经得到一条纯色的流光了,但是纯色的流光不好看,而且可以用dashOffset+dashArray来快速实现,没必要算这么多东西,所以下一步计算每段流光的渐变色才是最关键的。
5.对于整条流光而言,在转弯时,会被切割成多段流光,我们需要先计算出每段流光的起始点占整段流光的百分比(t1和t2),然后根据 t1、t2 对头部颜色和尾部颜色进行线性插值计算,算出每段流光的起始点颜色,这样在绘制完整条流光后,它的起始点颜色将始终是设定的头部颜色和尾部颜色, 且中间的转折点颜色也能正常过渡。下面是代码示例:
//根据分割后的线段计算每段线段需要的渐变色
const gradients = calcGradients(
    offset>sum?interPolaColor(headColor,tailColor,(offset-sum)/lightLen):headColor,
    offset<lightLen?interPolaColor(headColor,tailColor,offset/lightLen):tailColor,
    lines
)
//对两个颜色进行线性插值, t∈[0,1]
function interPolaColor(color1, color2, t){
    const {r:r1,g:g1,b:b1,a:a1=1} = color1;
    const {r:r2,g:g2,b:b2,a:a2=1} = color2;
    const r = r2-r1, g=g2-g1, b=b2-b1, a=a2-a1;
    return {
        r:Math.round(r1+t*r),
        g:Math.round(g1+t*g),
        b:Math.round(b1+t*b),
        a:+(a1+t*a).toFixed(2)
    }
}
//计算当前渐变数组
function calcGradients(color1, color2, lines){
    let sum = 0;
    return lines.map(d=>{
        const dx=d[0][0]-d[1][0], dy=d[0][1]-d[1][1];
        const dis = Math.sqrt(dx**2+dy**2);
        const start = sum;
        sum+=dis;
        const startColor = interPolaColor(color2, color1, start/lightLen), endColor =  interPolaColor(color2, color1, sum/lightLen);
        return {
            start:d[0],
            end:d[1],
            gradient:[
                `rgba(${startColor.r},${startColor.g},${startColor.b},${startColor.a})`,
                `rgba(${endColor.r},${endColor.g},${endColor.b},${endColor.a})`
            ]
        }
    });
}
上述代码中,计算渐变色的函数 calcGradients 需要3个参数,其中前两个是头部颜色和尾部颜色,第三个参数是流光的点位数据,该数据在第四步中已得到。我们需要做的就是遍历流光的点位数据,得到每段流光的长度,进行累加,然后将每段流光的起始点对应的长度值除以流光长度,就能得到 t 值,得到 t 值后就可以进行线性插值得到对应的颜色值。这里有个注意的地方就是在传参时,如果流光并没有完整的展现在路径中(当 offset < lightLen和 offset > sum 时),我们需要对头部颜色和尾部颜色先进行一次线性插值,因为此时我们只需要渐变色的一部分就好了,而不是完整的渐变色。
6.最后一步,我们使用requestAnimationFrame开启帧动画,在每一帧中修改 offset 的值,让流光动起来即可,完整代码如下:
<!DOCTYPE html>
<html lang="en">
<head>
    <meta charset="UTF-8">
    <meta name="viewport" content="width=device-width, initial-scale=1.0">
    <title>Document</title>
    <style>
        *{
            box-sizing: border-box;
        }
    </style>
</head>
<body>
    <canvas id="canvas" width="500" height="500"></canvas>
    <script>
        //路径数据,这里只考虑直线路径
        let pathData = [
            [100,100],
            [200,100],
            [250,150],
            [250,200],
            [230,250],
            [170,170],
            [140,230],
            [100,230]
        ];
        const canvas = document.getElementById("canvas");
        const ctx = canvas.getContext("2d");
        const lightLen = 100;    //流光长度
        let offset = 0;         //流光移动的距离,范围在[0, 路径长度+流光长度]
        const track = initPathObj();    //初始化流光的轨迹对象
        const headColor = {r:255,g:255,b:0,a:1}, tailColor={r:255,g:0,b:0,a:0.2};      //流光的尾部颜色和头部颜色
        const { paths, sum } = formatPath(pathData);        //paths是每一段线的信息,sum 是完整路径的长度

        const animation = ()=>{
            //将流光根据转折点切分成多段线条进行绘制
            const lines = calcPoints(paths, [offset-lightLen, offset]);
            //根据分割后的线段计算每段线段需要的渐变色
            const gradients = calcGradients(
                offset>sum?interPolaColor(headColor,tailColor,(offset-sum)/lightLen):headColor,
                offset<lightLen?interPolaColor(headColor,tailColor,offset/lightLen):tailColor,
                lines
            )
            ctx.clearRect(0,0,500,500);
            ctx.save();
            ctx.lineWidth=5;
            ctx.strokeStyle="rgba(128,128,128,0.2)";
            ctx.stroke(track);
            ctx.lineWidth=5;
            //分段绘制流光
            lines.forEach((d,i)=>{
                const {start, end, gradient:grad} = gradients[i];
                gradient = ctx.createLinearGradient(start[0],start[1],end[0],end[1]);
                gradient.addColorStop(0,grad[0]);
                gradient.addColorStop(1,grad[1]);
                ctx.strokeStyle = gradient;
                ctx.beginPath();
                ctx.moveTo(d[0][0],d[0][1]);
                ctx.lineTo(d[1][0],d[1][1]);
                ctx.stroke();
            })
            ctx.restore();
            offset = (offset+0.5)%(sum+lightLen);       //每一帧增加0.5的移动距离,在流光完全消失后将offset重置为0
            requestAnimationFrame(animation);
        }
        animation();
        //初始化流光的轨迹对象
        function initPathObj(){
            let path = new Path2D();
            path.moveTo(pathData[0][0],pathData[0][1]);
            pathData.slice(1).forEach(d=>{
                path.lineTo(d[0],d[1]);
            });
            return path;
        }
        //计算每段小路径的数值区间和线性函数
        function formatPath(data){
            let sum = 0;
            let res = [];
            data.slice(1).forEach((d, i)=>{
                const [x1, y1] = data[i], [x2, y2] = d;
                const dx = x2-x1, dy = y2-y1;
                const dis = Math.sqrt(dx**2+dy**2);     //两点之间的距离
                const range = [sum, sum+dis];
                const rad = dx==0?(dy>0?1:-1)*Math.PI/2:Math.atan(dy/dx)+(dx<0?Math.PI:0);
                res.push({
                    dis,
                    pos:[[x1,y1], [x2,y2]],      //线段的起始点坐标
                    range,        //线段所含区间
                    rad,  //线段与x轴的夹角
                    linearFn:(offset)=>[x1 + (offset-range[0]) * Math.cos(rad), y1 + (offset-range[0]) * Math.sin(rad)]
                });
                sum+=dis;
            });
            return {paths:res,sum};
        }
        //计算当前流光点位数组
        function calcPoints(paths, steps){
            const [step1, step2] = steps;
            return paths.flatMap(d=>{
                const [small, large]=d.range;
                if(small>=step1 && large<=step2){     // __|__|__
                    return [d.pos];
                }else if(small<=step1 && large>=step2){       // | ___ |
                    return [[d.linearFn(step1),d.linearFn(step2)]];
                }else if(small<=step1&& large>=step1){       // | __|__
                    return [[d.linearFn(step1),d.pos[1]]];
                }else if(small<=step2 && large>=step2){       // __|__ |
                    return [[d.pos[0],d.linearFn(step2)]];
                }
                return [];
            });
        }
        //对两个颜色进行线性插值, t∈[0,1]
        function interPolaColor(color1, color2, t){
            const {r:r1,g:g1,b:b1,a:a1=1} = color1;
            const {r:r2,g:g2,b:b2,a:a2=1} = color2;
            const r = r2-r1, g=g2-g1, b=b2-b1, a=a2-a1;
            return {
                r:Math.round(r1+t*r),
                g:Math.round(g1+t*g),
                b:Math.round(b1+t*b),
                a:+(a1+t*a).toFixed(2)
            }
        }
        //计算当前渐变数组
        function calcGradients(color1, color2, lines){
            let sum = 0;
            return lines.map(d=>{
                const dx=d[0][0]-d[1][0], dy=d[0][1]-d[1][1];
                const dis = Math.sqrt(dx**2+dy**2);
                const start = sum;
                sum+=dis;
                const startColor = interPolaColor(color2, color1, start/lightLen), endColor =  interPolaColor(color2, color1, sum/lightLen);
                return {
                    start:d[0],
                    end:d[1],
                    gradient:[
                        `rgba(${startColor.r},${startColor.g},${startColor.b},${startColor.a})`,
                        `rgba(${endColor.r},${endColor.g},${endColor.b},${endColor.a})`
                    ]
                }
            });
        }
    </script>
</body>
</html>绘制渐变流光其实并没有用到什么复杂的api,完全就是数学的计算和最简单的线性插值函数,感兴趣的同学还可以试着在路径中加入椭圆弧、贝塞尔曲线后,再来实现一下渐变流光,可能会增加代码的复杂度,但是其核心原理还是不变的,依旧是将路径分段,先求出流光的点位数据,再根据点位数据求出渐变色数据,最后分段绘制即可。
文章
3.46K人气
8粉丝
1关注
更多数字孪生可视化干货内容


 扫一扫关注公众号
 扫一扫联系客服
©Copyrights 2016-2022 杭州易知微科技有限公司 浙ICP备2021017017号-3  浙公网安备33011002011932号
互联网信息服务业务 合字B2-20220090